Anchor charts have long been identified as a high-yield learning tool. What exactly is an anchor chart? Why use them? How do you determine what should be on an anchor chart? These are common questions faced by teachers as they try to establish optimum learning environments for their students.
I have heard anchor charts best described as the ‘third teacher’. The following is a quote from Scholastic’s Literacy Place – For The Early Years, 2010. “ To promote literacy skills and encourage independence, you will want to make strategic and purposeful use of print resources such as posters, signs, lists, charts, and student/teacher writing samples in your classroom. One tool in particular, the anchor chart, is very effective in promoting student success. An anchor chart outlines or describes procedures, processes, and strategies on a particular theme or topic and is posted in the classroom for reference by students. Examples of anchor charts include: what to do in an interview, tips on using commas, what readers need to do when they infer, how to choose just right’ books, or how to write a literature response.”
This of course aligns perfectly with the visual learner. Visual learners learn through seeing, observing and anchor charts allow them perpetual access to critical information and not just when instruction by a teacher is occurring. They can return to the key ideas or concepts when they need to and as often as they need to.
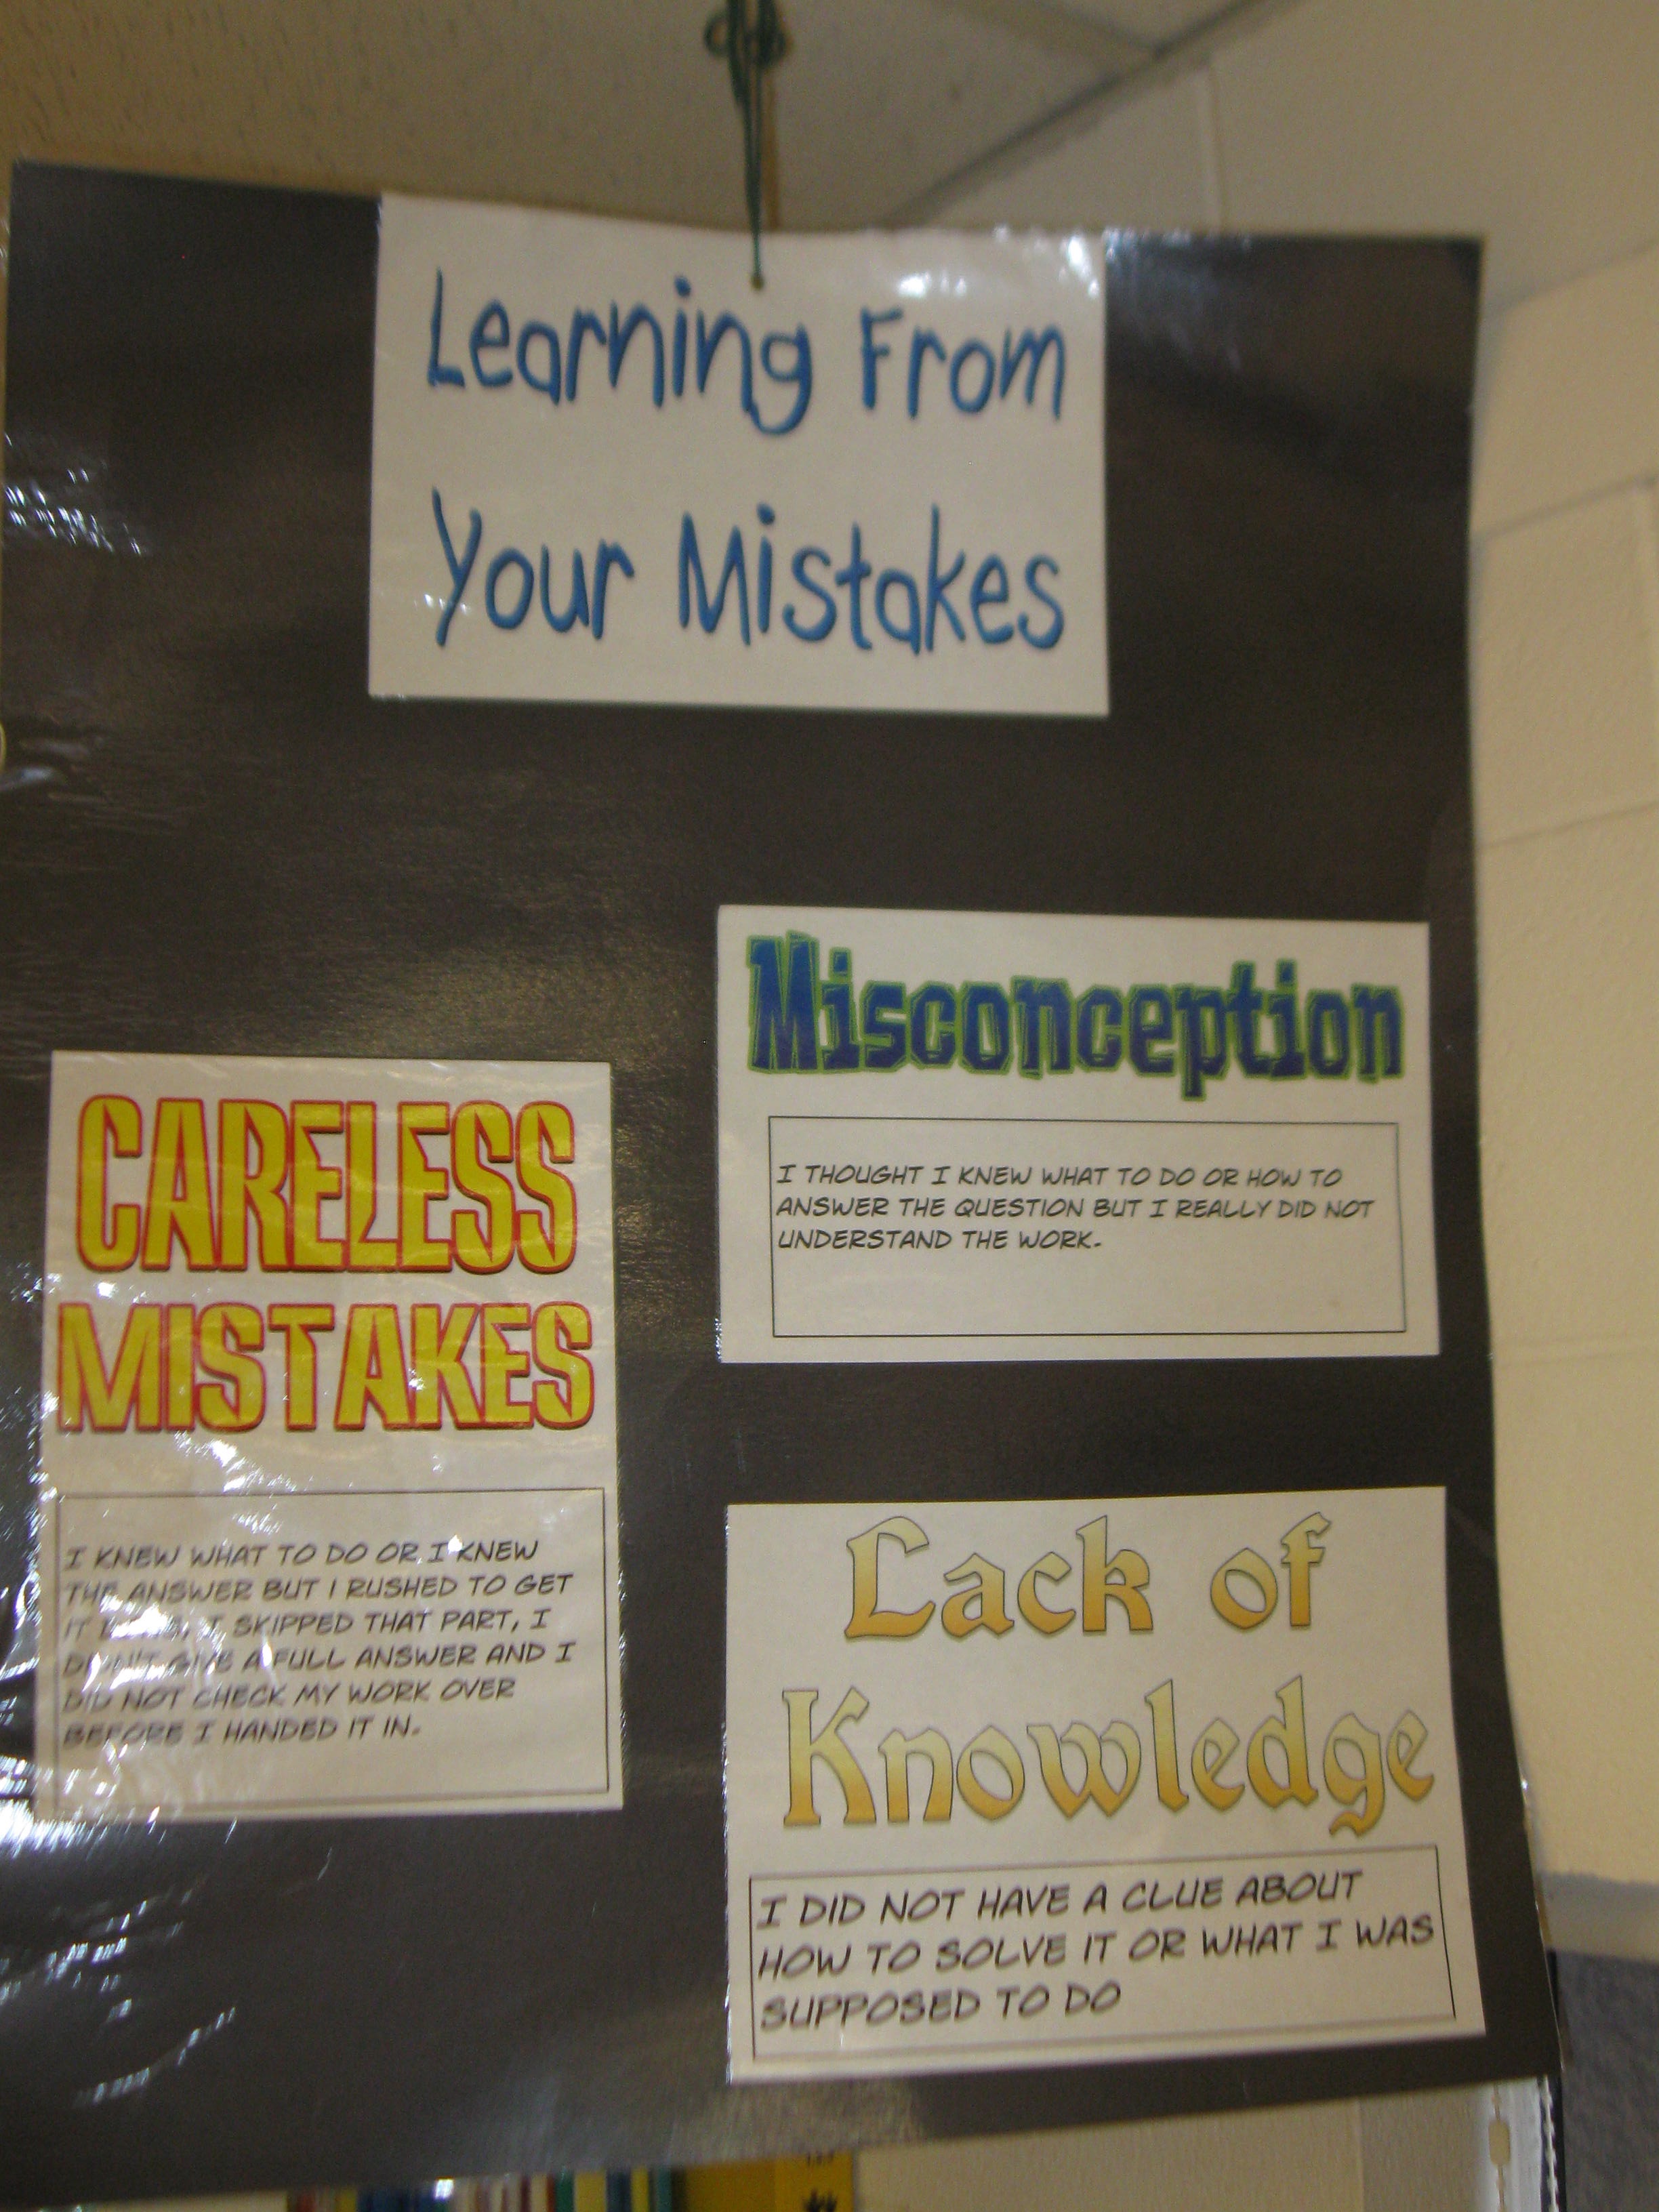
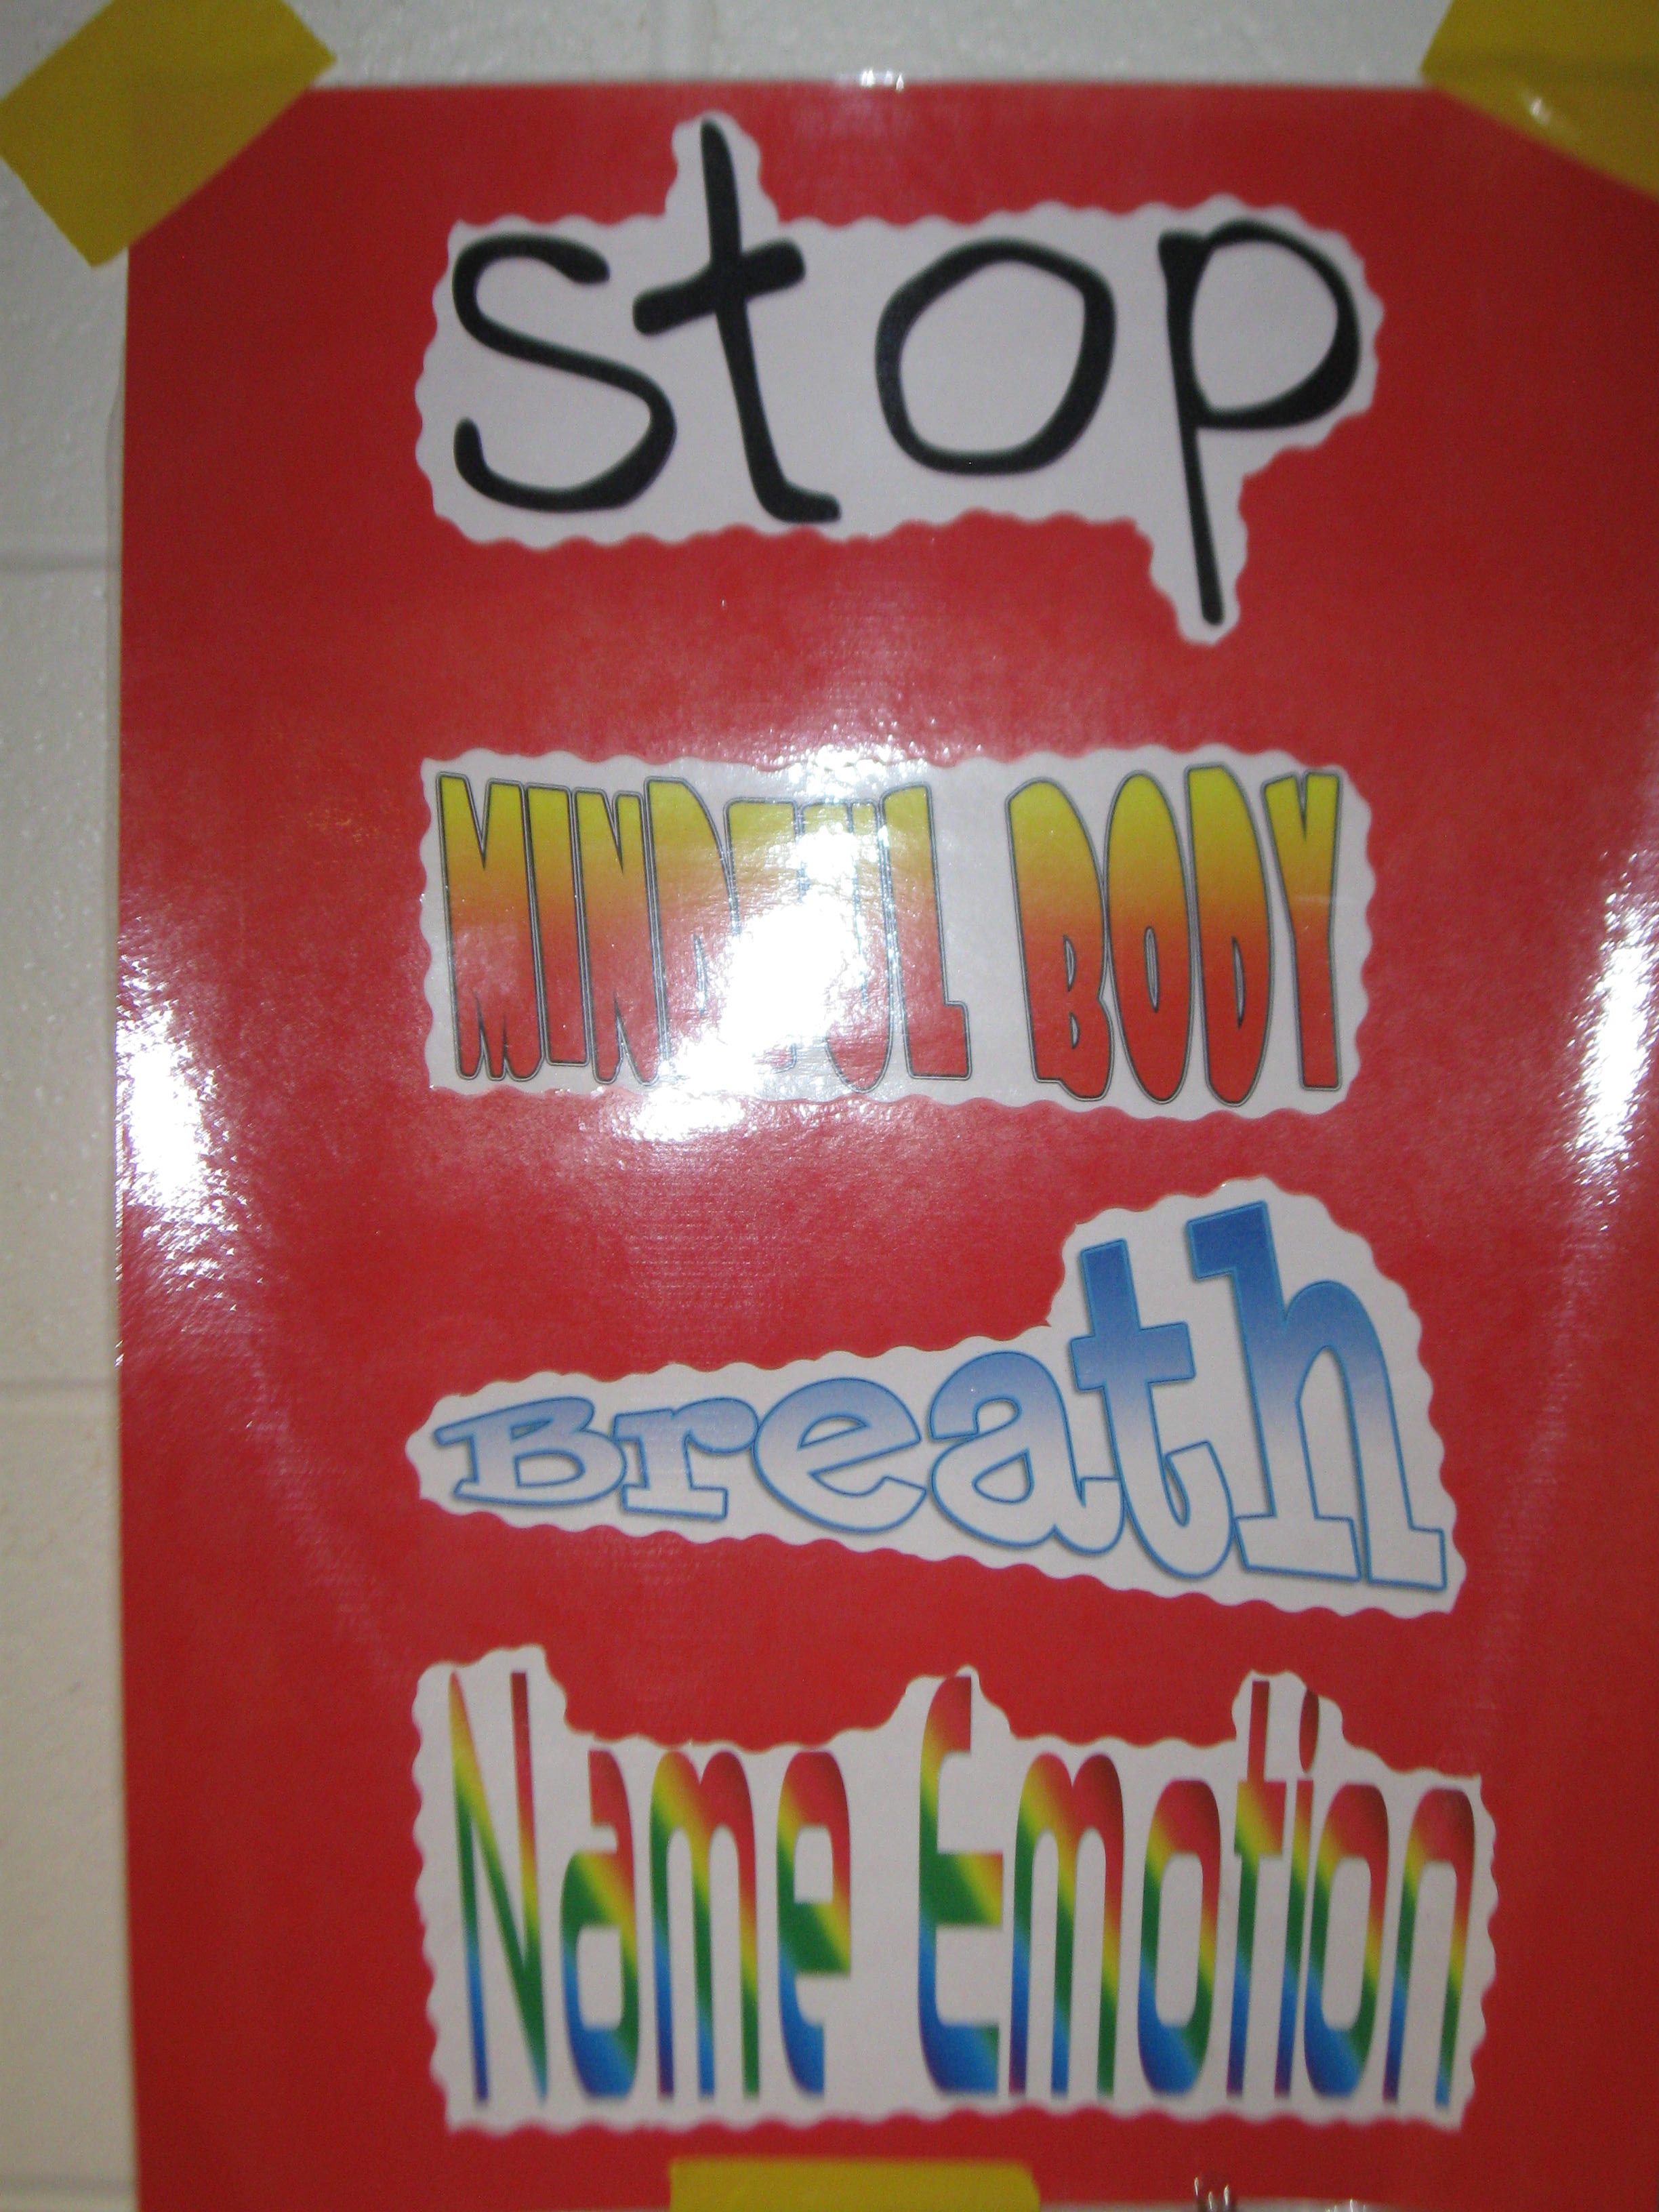
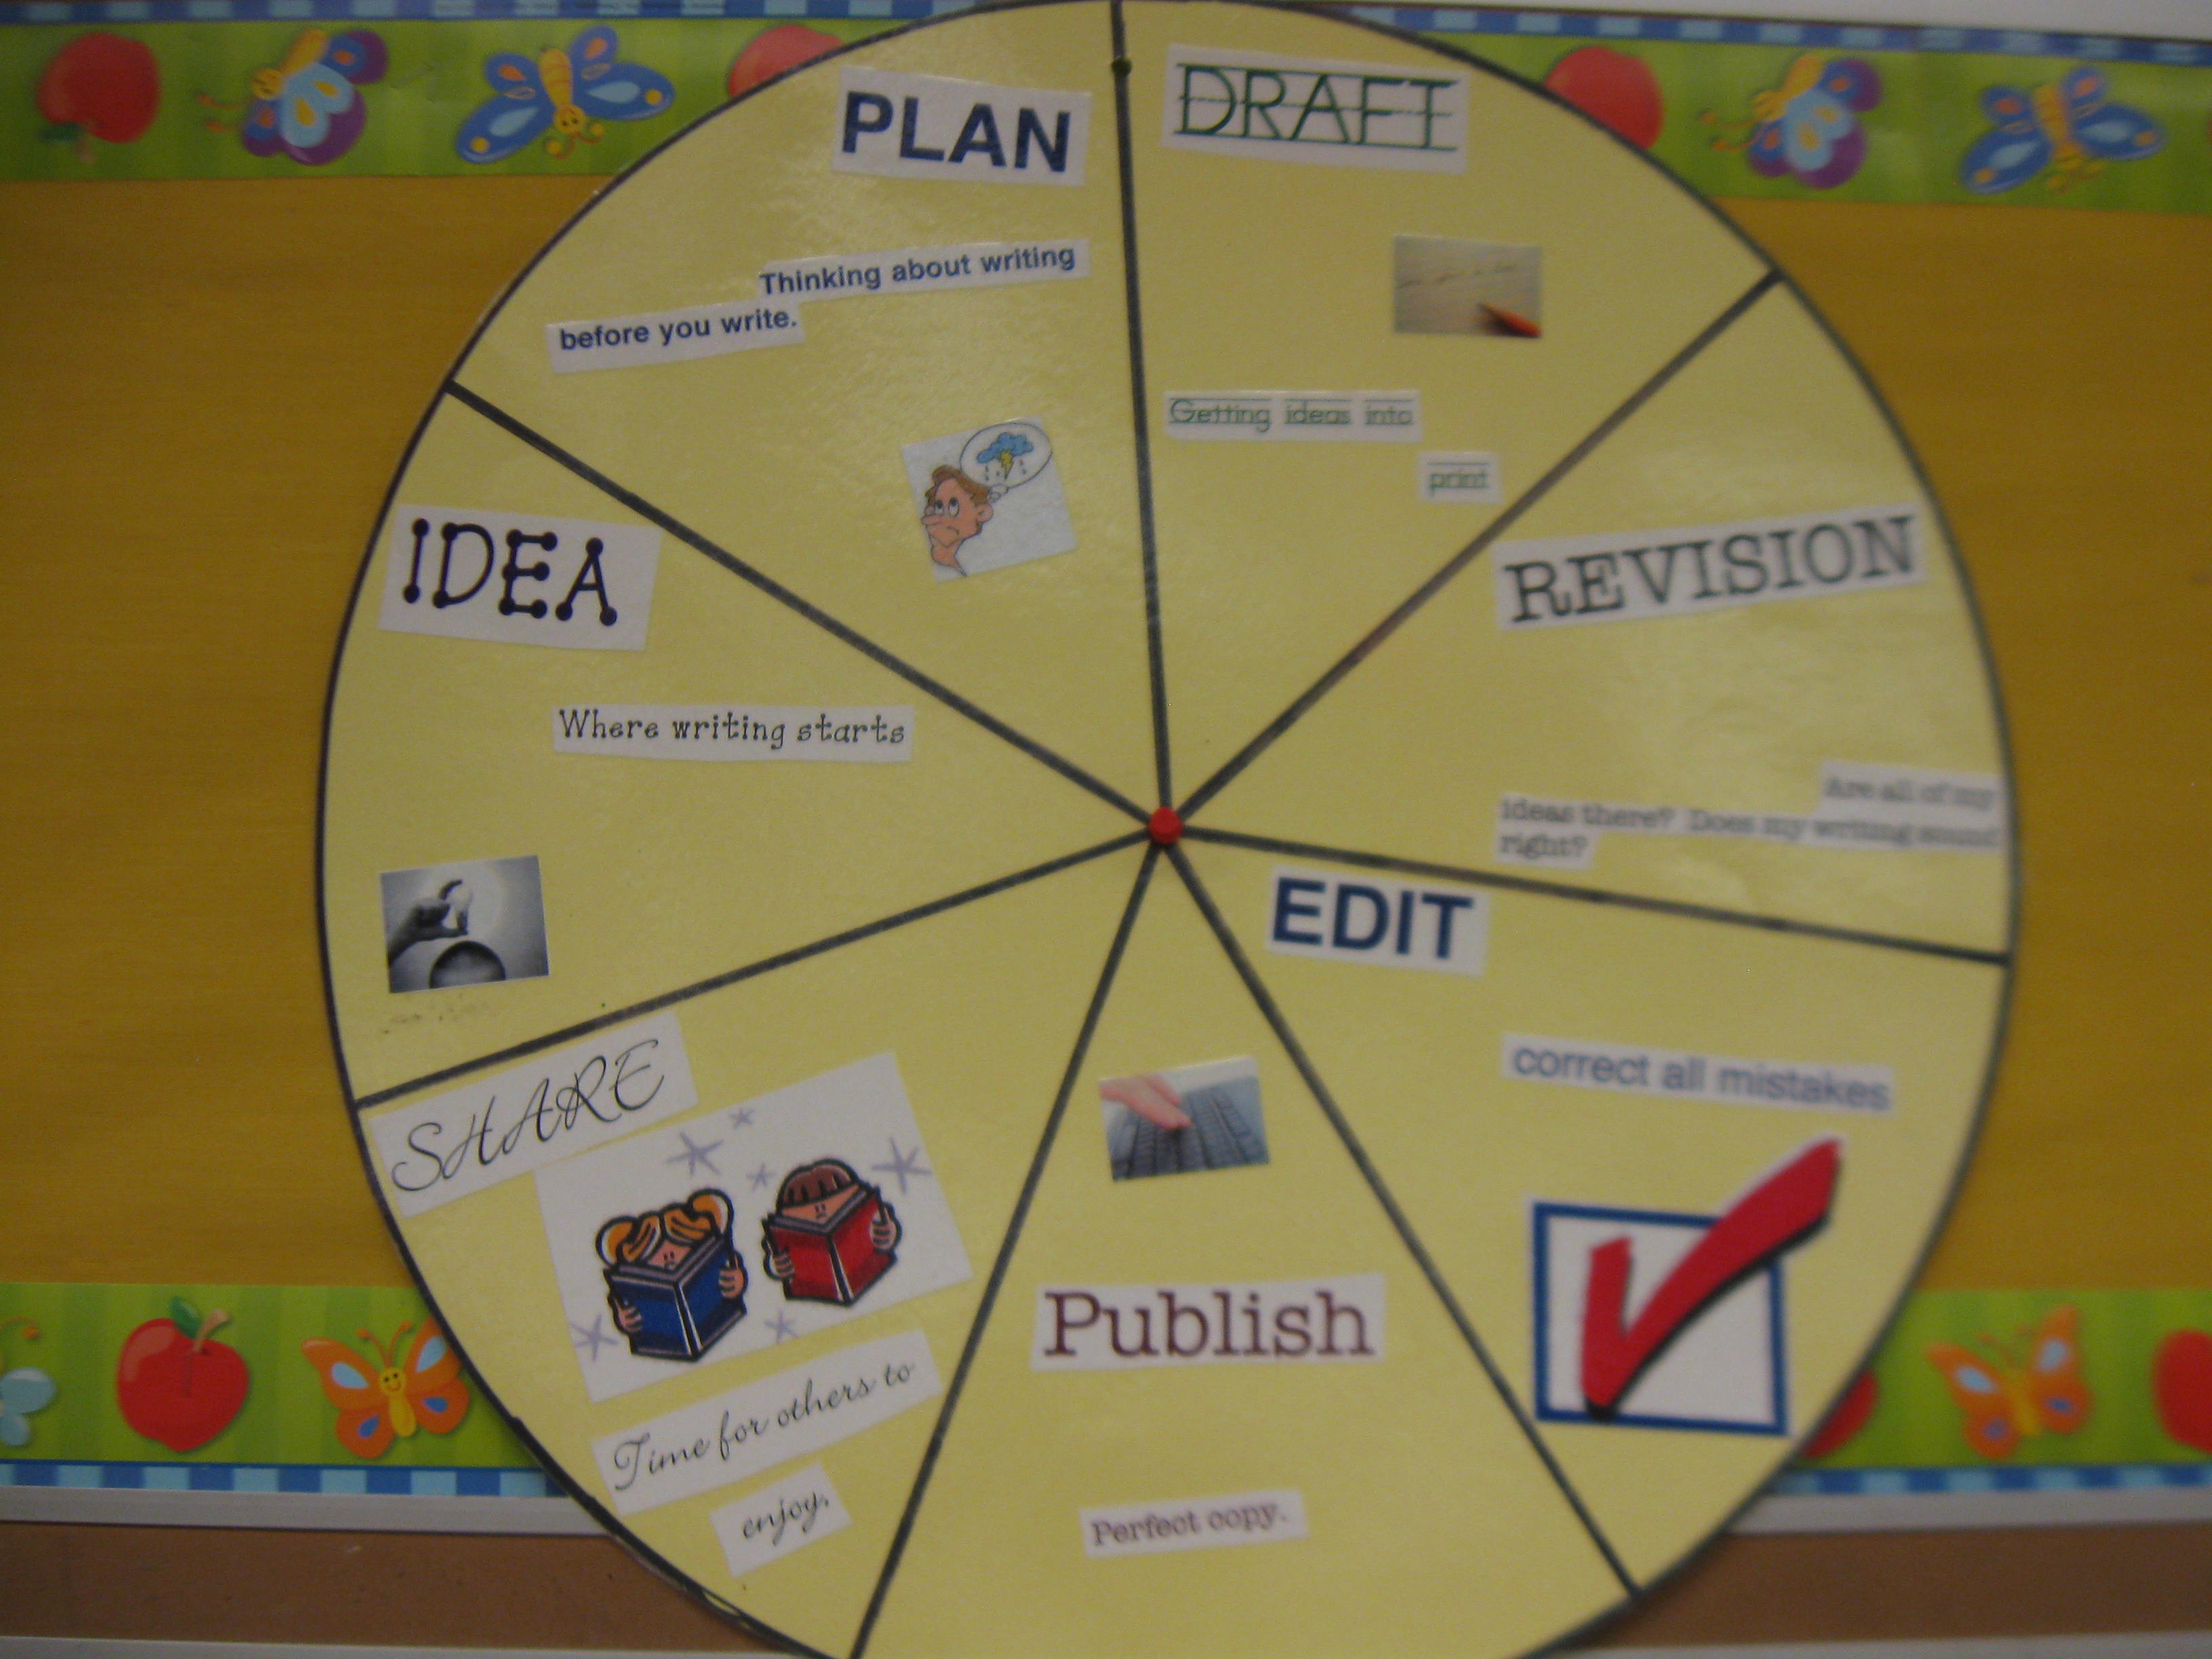
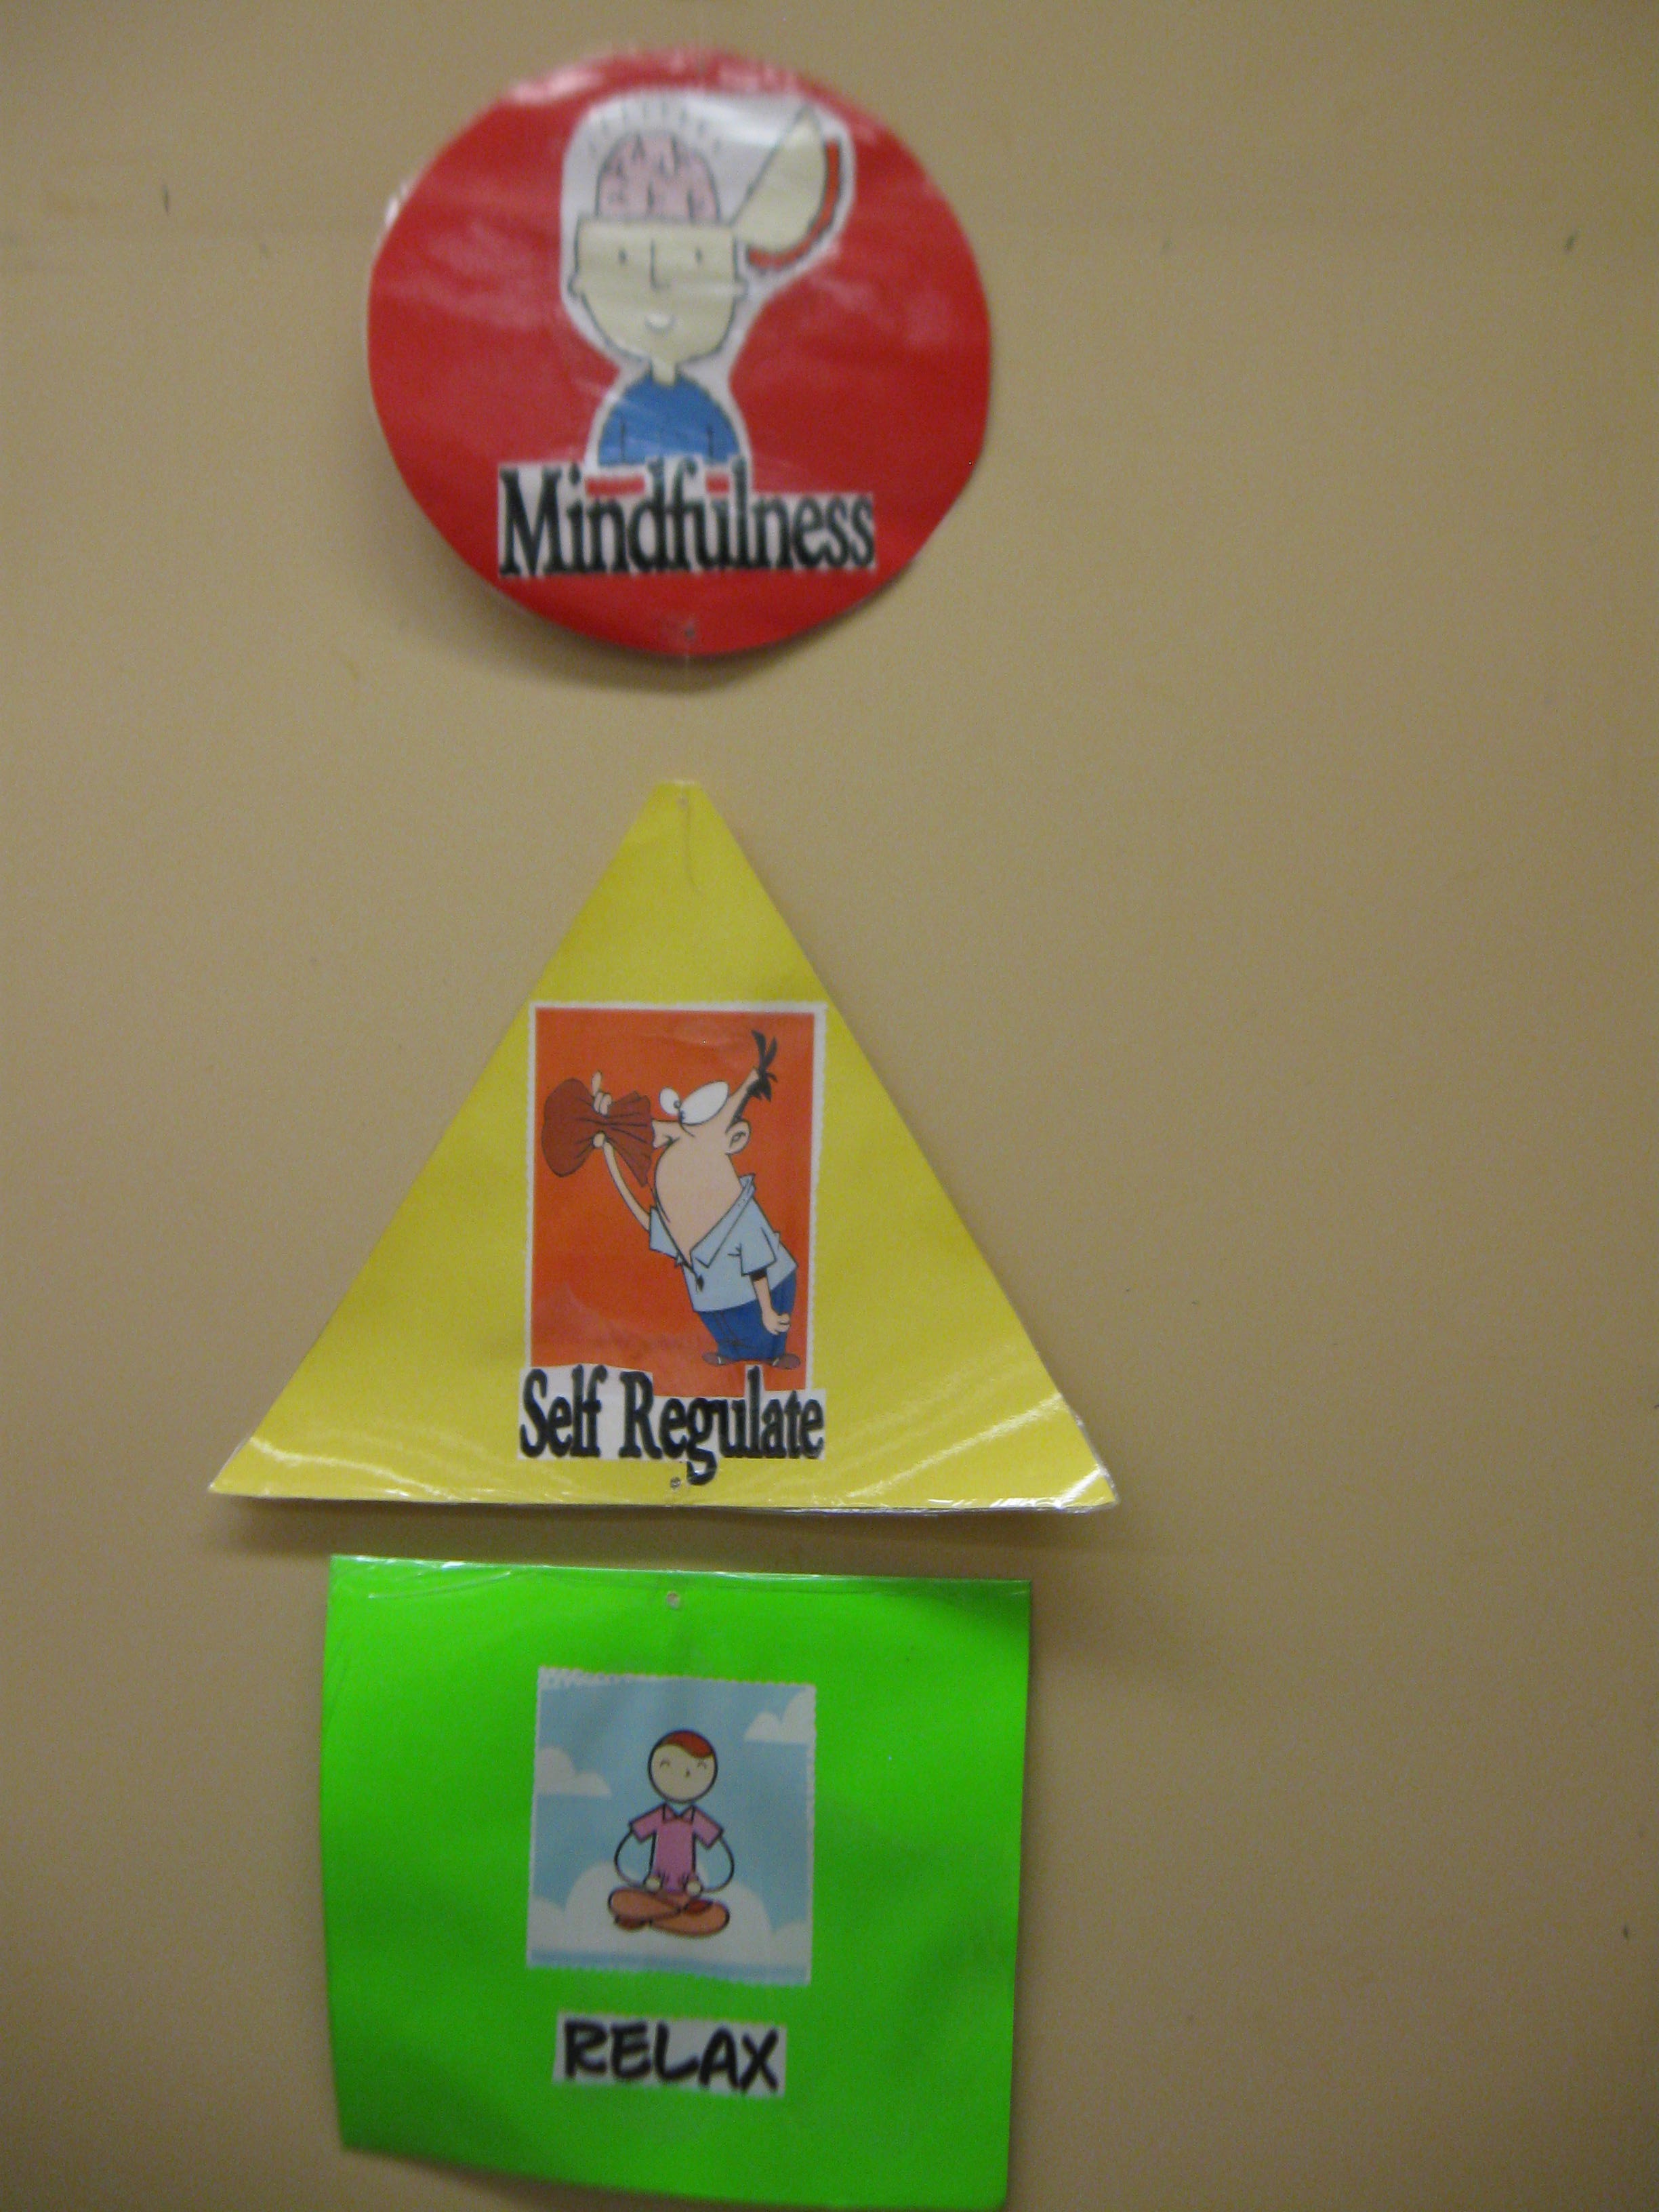
One lesson that I have learned is that not everything can be an anchor chart even though it is all so valuable. If the visual scene in your classroom becomes cluttered the benefits of this tool diminish as they just become part of the scenery and no longer a tool for the students. In my class we have a large variety of anchor charts positioned around the classroom with different colours, fonts, sizes, shapes and almost any other way I can make them unique and stick out. I did an experiment with my students one day where I gave them post it notes and asked them to go around and put them on the anchor charts they used most often and felt were most helpful to them. Prior to that I had made my prediction of what might occur. Needless to say, what I thought was most important did not align with their view. Sooooo from that point on, my anchor charts became a mutual task created by my students and myself. I still do all of the finish work, but the content and positioning in the room is a shared decision. One final change in my practice as a result of that data collection was that I am constantly changing the visual cues so that they stay fresh as learning tools and not just become a regular site in the room.
Another feature of this great tool is that I also have personal anchor charts around my desk that help me as I learn new pedagogy to add to my practice. I am able to return to them throughout the day to evaluate my growth and development progress.