This month we’ve been learning about probability. We started off by watching videos and learning about probability language. From there, older students connected probability language, representing the likelihood of events on a probability line. We’re running a series of probability experiments and spiralling back to some of the work that students already did in Data Management with graphing and analyzing the data. All-in-all, it’s been a busy and exciting month learning about probability from kindergarten to grade 5!
Kindergarten
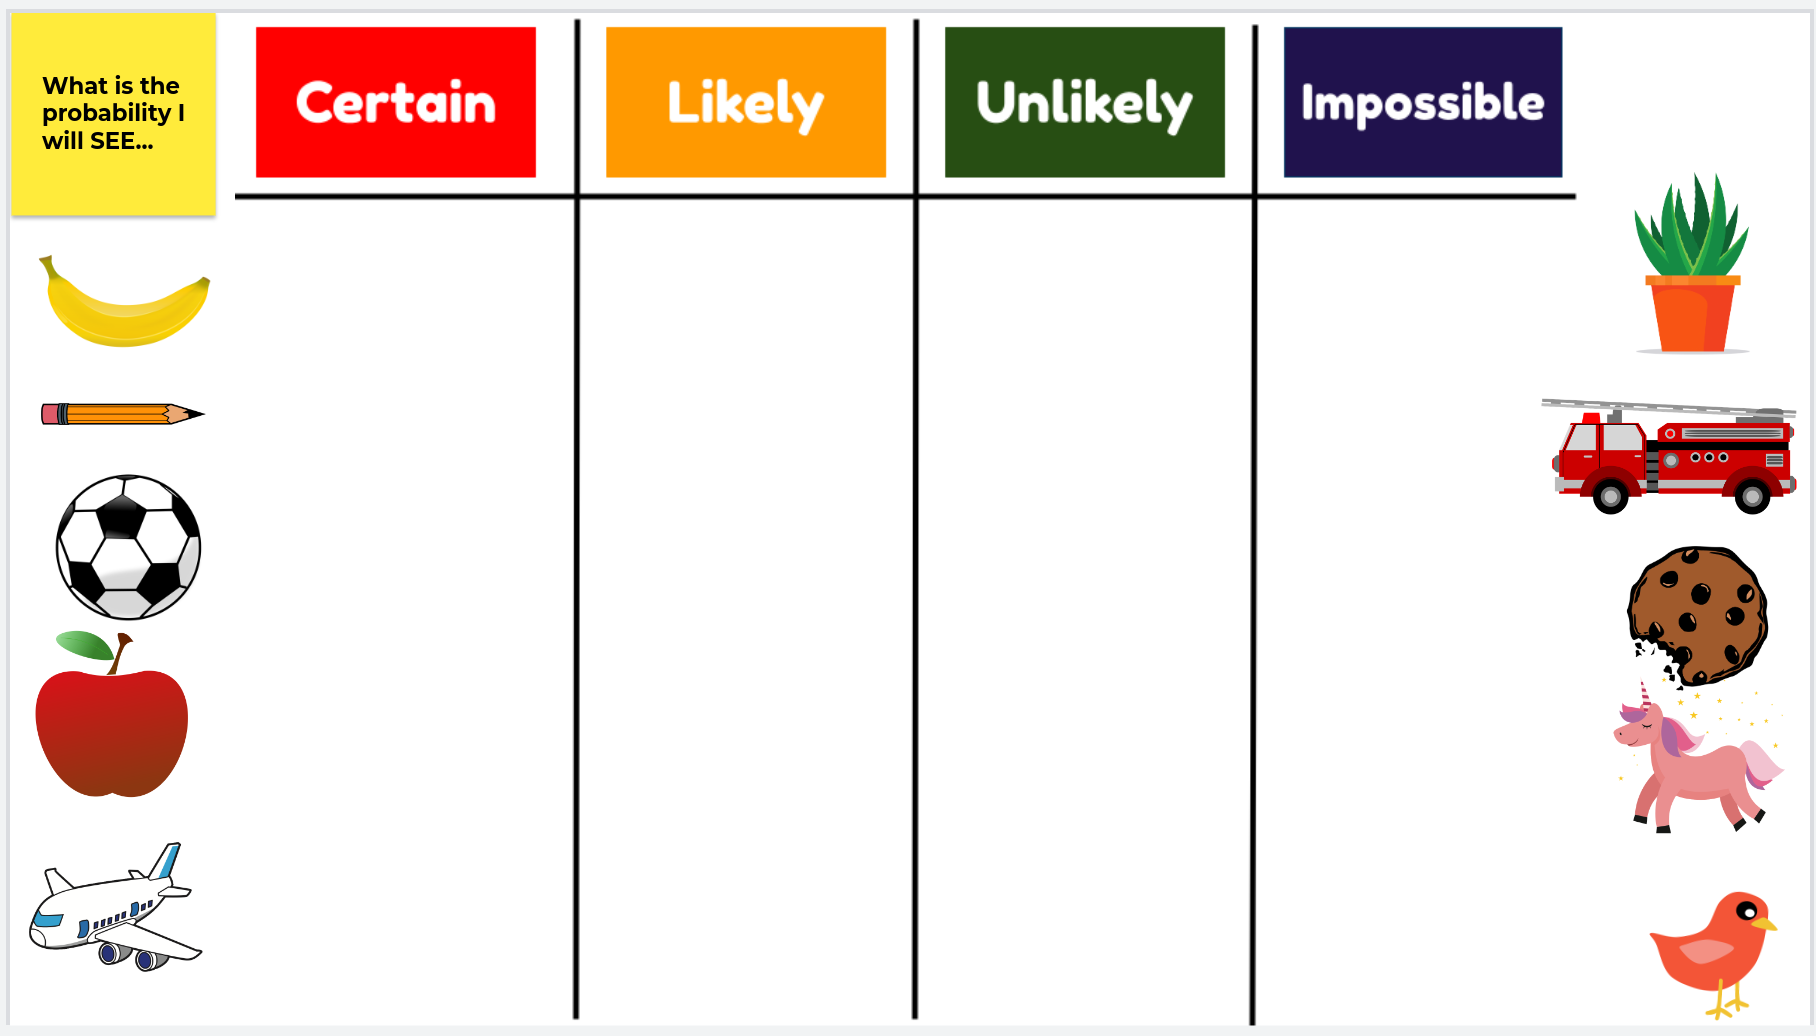 In kindergarten, it’s been all about probability language and explaining our answers. The students are learning that there isn’t always just one right answer but that we can have different answers that can still be correct. One example was the probability of having dessert after dinner. When asked, some students said certain because they always have dessert. Others said that it was unlikely because they rarely have dessert, while still, others said it was impossible because they can’t have sugar in the evening. We learned that our justification was just as important as our answer. One activity that we did was in Jamboard where students sorted items based on their probability of either seeing them or eating them.
Primary Classes
 Give primary students a quarter and the excitement in the room is palpable. After trying their hand at the Jamboard to learn more about probability language, students started to get into doing some experiments and talking about events that are equally likely. Tasked with tossing a coin 20 times, students had to colour in a chart that served as the graph of their data. We also spoke about sample size and I collected the data from multiple classes to show the difference between the results from one group, one class, and then the entire sample who tossed the coin. We’re going to be designing spinners next and using our probability language to make predictions and then analyze our results.
Junior Classes
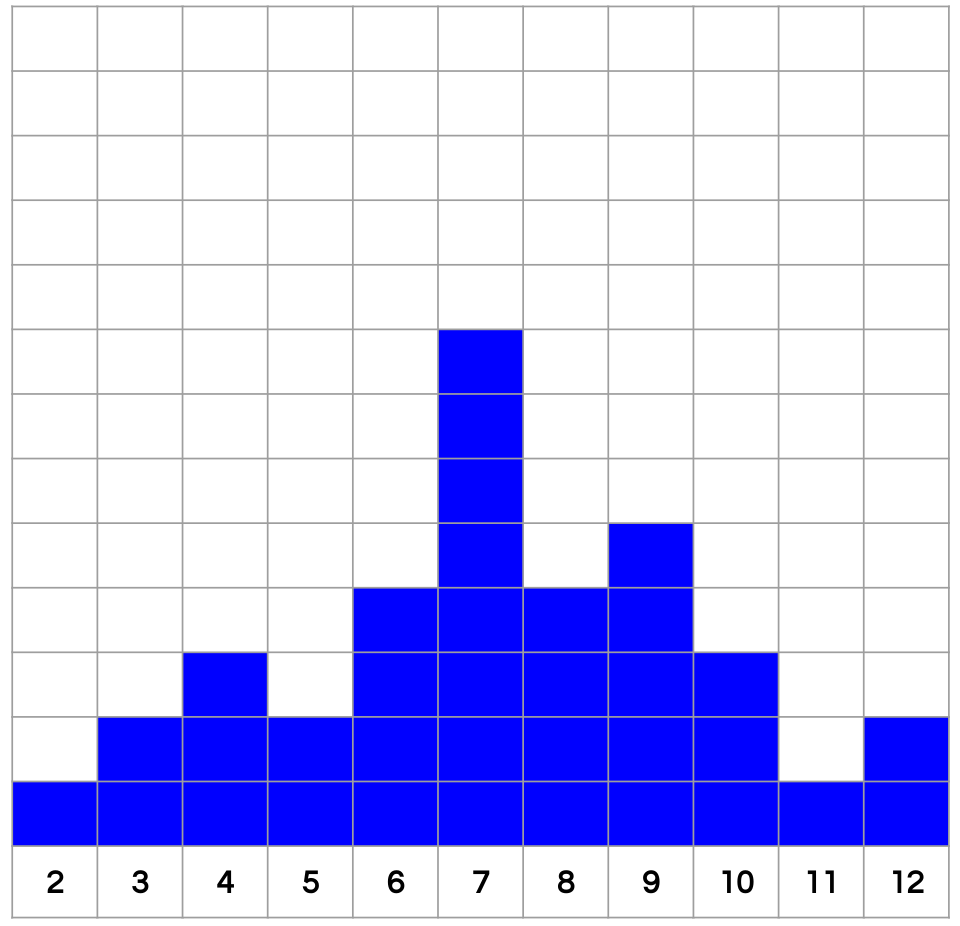 Who knew that rolling a number cube could be so exciting? I did run out of number cubes so we’ve also been using Mathigon Polypad and the excitement is similar. We’ve done 2 experiments so far with our number cubes. The first was to see the results of 30 tosses with one number cube. The second was to investigate what happens when we roll 2 number cubes, 35 times. We were interested in finding the probability of the sum of each roll. We started out by making predictions and after about 10 rolls, some students were already wanting to change their predictions. This led to conversations about which sums would be more likely than others. After graphing their results, we collected the data from different groups and have been analyzing it.
Up next
Now that students have an understanding of probability, they will be tasked with creating their own games that involve probability. There are a number of online templates available that I can share with students or they can choose to design their own games using found materials in the classroom. For some of our activities, we have been using Alice Keeler’s blank dice roll template. May will be a month of creating and hopefully we’ll have some new and exciting games to try.